
Background
What drives advertising profitability? What are the factors you can focus on that will give you the maximum marketing benefit? How can you work out where to allocate resource? Wouldn’t it be great if there was a rigorously researched, evidence-based checklist?
Well, there is – or was.
Back in 2014, Paul Dyson, founder of the econometric consultancy Data2Decisions, conducted an analysis which revealed the drivers of profitability (itself an update of work done in 2006). That analysis identified and ranked the ROI multiplier effects of various different advertising considerations.
What emerged from the analysis was that creative execution was by far the single most important element of advertising under a marketer’s direct control when it comes to delivering return on investment. Behind it were a host of different media planning and strategy factors that were all vital to success too. But creativity shone out as something that could yield special results.
This chimed with other research. Nielsen, Binet & Field – even McKinsey’s, a famously rationally-orientated consultancy – all concluded that businesses that excel in creativity perform the best in terms of hard financial metrics. Creative was the single biggest lever that we can pull when it comes to supercharging marketing ROI.
So what’s the problem?
Well, the media landscape has changed dramatically since these past analyses were carried out. 40% of ad revenue now goes to online search (about £14 billion); Meta has trained emerging businesses to adopt a test and learn mentality to creative execution; and Netflix (which remains almost entirely ad free) has changed the face of the TV landscape.
Against this backdrop, Thinkbox commissioned Paul Dyson (now co-founder of accelero), to revisit his analysis. How had things changed since 2014?
Approach
Paul’s 2014 analysis was carried out using econometric analysis of individual campaigns within the Data2Decisions databank.
This time, rather than relying on one database from one agency, the team from accelero looked at the consensus of opinion around the drivers of profitability across many different businesses, using publicly available case histories, industry reports, and academic papers.
Searching through hundreds of studies, accelero collated around 28,000 global campaigns, of which about 7,000 were UK campaigns. This was a very robust sample from which to unpick the variables that most influence ROI.
Factors influencing ROI
Category
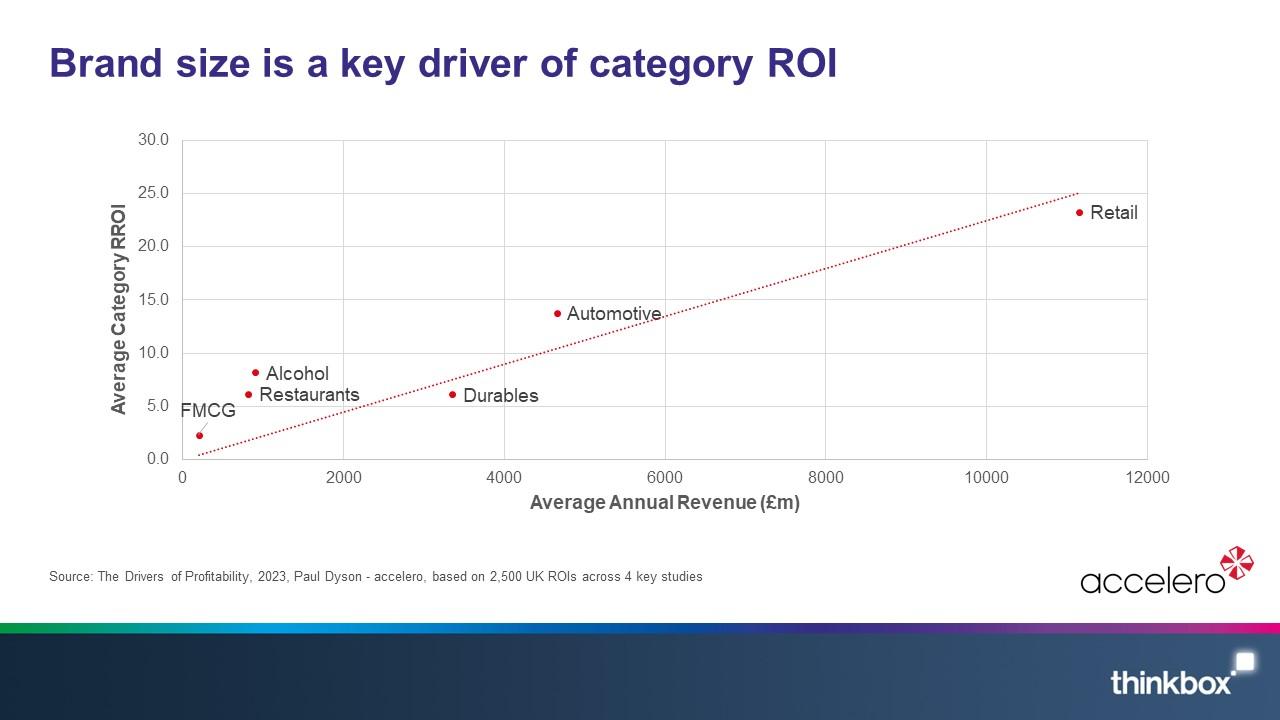
The above chart demonstrates that there is a big difference between the average ROI achieved across different categories and that this broadly correlates to business size.
For example, Retailers are much bigger businesses than individual FMCG brands. Retailers averaged a business size of just over £11 billion whilst the FMCG brands average around the £100m mark.
But why does this affect ROI?
Ultimately, this comes down to business characteristics such as penetration, average revenue per customer, and purchase frequency.
To take an extreme example, think of the difference between a supermarket like Tesco and an individual brand like Fairy Liquid. Whilst Fairy might have a similar penetration to a supermarket like Tesco, it’s going to be relatively miniscule in terms of its average revenue per customer and purchase – yet the unit cost of advertising is going to be broadly similar for both brands. Therefore, the potential of advertising to deliver ROI is going to be much higher for the bigger business.
Based on the cases explored in this study, accelero found that the potential ROI multiplier generated by simply being a (very) big business is x 20.
Budget
The other key variable that influences ROI is budget.
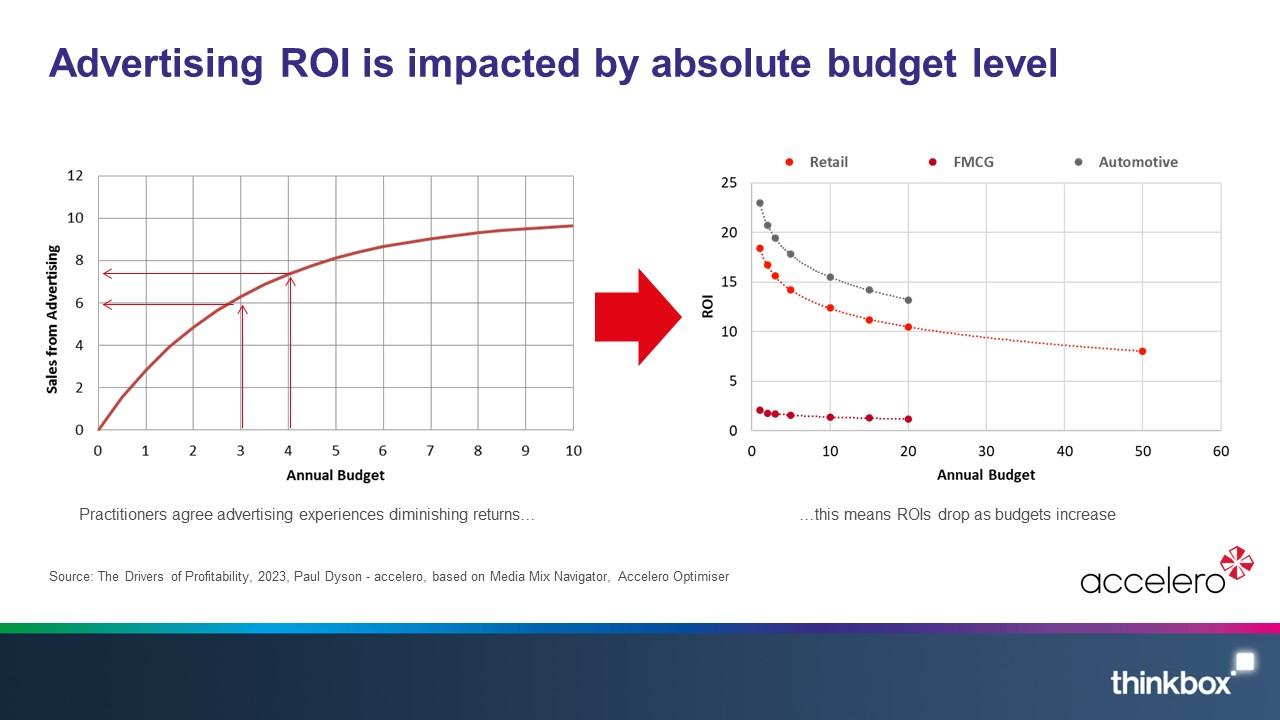
Increased advertising spend follows a diminishing returns curve – each extra pound you invest in advertising generates slightly less than the previous pound you invested (see chart above).
It follows that, as you increase your budget, your ROI ratio starts to decrease. So logic suggests that the best way to maximize ROI is to spend as little as possible (because the ROI ratio would get bigger and bigger with less and less spend).
That’s why people argue that ROI isn’t necessarily a good measure to prioritise; you deliver a high multiplier on your investment at the expense of making high profit. But the objective should be profit – ideally brands maximise investment, only capping spend once the point has been hit where diminishing returns suggest that the next pound is better saved or invested in a more profitable activity.
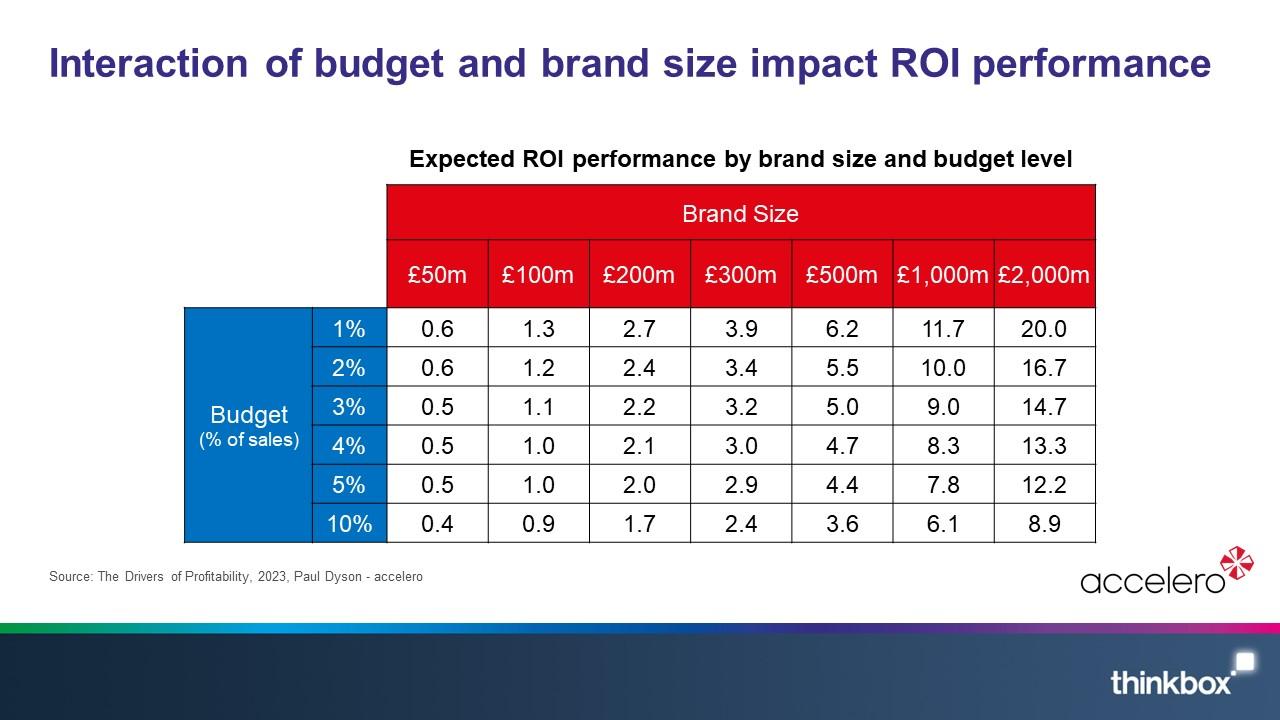
Using the Media Mix Navigator (based on econometric data from 52 WPP brands), together with accelero’s own optimizer, accelero looked at what happens to ROI with different budgets for different brands with different business sizes.
In the table below, you can see that, on average, ROI roughly halves when comparing a very low spend with a very high budget. For an automotive brand with an annual revenue of £2bn, at a very low budget (1-2% of turnover) you might expect something in the 17 to 20 ROI range. But at a really high spend of 10% you'd be getting down to something like an ROI of 9.
Creativity
Given the big influence of brand size and budget on the potential ROI a campaign can achieve, the simplest way to assess just the creative impact is to look specifically at the performance of a single brand. By doing this, factors such as product category, brand size, distribution, competitive environment and, normally, budget are held static. As a result, the variation in ROI performance across a number of campaigns can be explained by the performance of the different creative executions used.
The IPA provides some good examples of this in action with well-known campaigns.
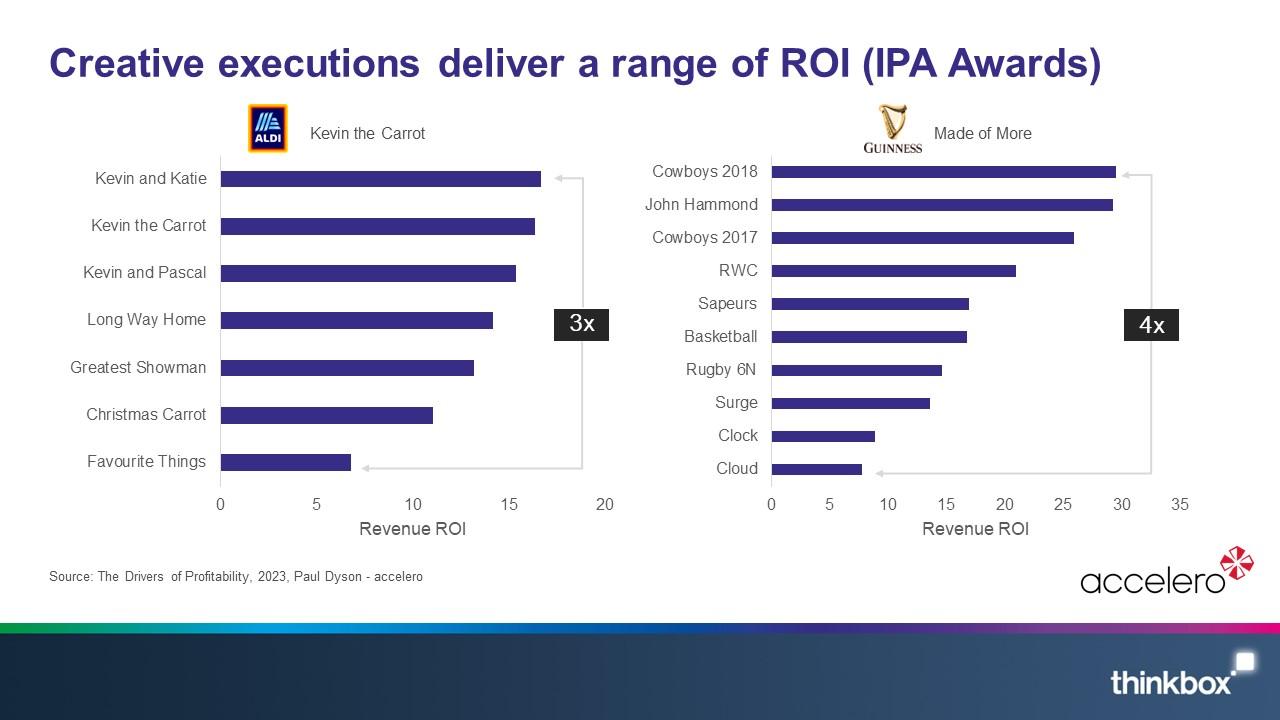
The charts above compare the performance of different creative executions for the same brand and their revenue ROI performance.
If you compare the performance of Aldi’s 2017 Kevin and Katie (Carrot) with the 2015 ‘Favourite things’ advert (both were Christmas campaigns, both had a similar investment in TV - circa. 3,000 ratings / £8m), there’s a three-fold multiplier in the performance of ‘Kevin and Katie’ compared to ‘favourite things’.
Guinness’s long-running ‘Made of more’ campaign shows a similar picture in the ROI variance across different creative executions. Here the lowest ROI was for their ‘Cloud’ campaign in 2012 and the highest for the 2018 ‘Cowboys’ campaign, and – as with Aldi – the TV campaigns are near identical in their weight (circa. 1,000 ratings each). So this is not an efficiency play where a small budget campaign is delivering a much higher ROI than a big budget campaign, this is a pure creative effect.
Delving into the broader database of 7,000 UK campaigns revealed a similar pattern. Looking solely at the range of ROI for different campaigns across the same brand accelero found that the potential creative ROI multiplier is 12, exactly as it was the last time this analysis was conducted back in 2014.
Budget setting
Optimising budgets can be a highly effective means of delivering a higher ROI multiplier, with limited budgets (who has unlimited budgets?!) comes the need to make sure that the money is being invested in the part of the business that is likely to deliver the highest return. In past analysis Paul Dyson broke out budget setting into three areas and again he found them all to have the potential to deliver a big difference in the potential ROI:
Budgets setting by geography: Some countries are simply more profitable than others, media prices vary by geography, as do distribution channels, profit margins, and product consideration. Brand size can also vary significantly. Allocating budgets across geographies in the optimum way can increase media profitability by up to a factor of 5. Many businesses are not set up to set global budgets centrally but the opportunity here makes it worth exploring.
Budgets setting across portfolios: Different brands within a given portfolio will have a different potential for ROI. As discussed earlier, the bigger brands will deliver a higher ROI simply because they have wider distribution (physical availability) or awareness (mental availability). Therefore prioritising the bigger brands in a portfolio will lead to a higher ROI for your budget. In the data we’ve seen this can provide a x3 multiplier on ROI.
Budgets setting across variants: As above, but for brand variants rather than different brands within a portfolio. Here we see the multiplier as high as x1.7.
Media Multipliers
Media planning and strategy are clearly a vital part of any campaign’s performance. Unlike ‘creative’, which is difficult to break down into constituent parts, with this updated analysis and from past analysis, it is possible to separate out some of the aspects of the media side of advertising and their potential to deliver ROI multipliers when fully optimised.
The explanation below sets out the different aspects of media planning and the multipliers observed by accelero…
Multimedia
It’s well documented that campaigns using more than one media channel benefit from media multiplier effects – the evidence accelero found is no different, suggesting that simply by using a multimedia strategy, there’s a potential ROI multiplier of 2.5.
Cost/Product seasonality
Most businesses have seasonal peaks and troughs. By advertising at the point when more customers are in market for your product (think holiday booking in Q1), you increase the potential return.
Media also has seasonal peaks and troughs in price. Q4, due to the run up to Christmas, is a typically high-demand period and in supply/demand-based markets (like TV) advertising is therefore more expensive.
By factoring for both media cost seasonality and the seasonality of your business, it’s possible to optimise the spend and generate a multiplier compared with a non-optimised campaign. The data here suggests that this could lead to a 1.6 ROI multiplier. This is low because the opportunity is limited – sales and cost seasonality may only vary by a small amount and of course favourable conditions may not align (high seasonal sales with low seasonal costs). However 60% improvement in media payback is well worth having!
Laydown/phasing
As shown above, media budgets experience diminishing returns – lower return for each additional £1 invested. This applies not only to annual budgets but also weekly phasing of media – spending more budget in a fixed period tends to build frequency rather than reach and can be less efficient. This effect is well-known and has lead to the idea of continuity – spreading the budget equally across the year to minimise diminishing returns. All other things being equal this would be the optimal approach but sales and cost seasonality along with the carry-over effect of advertising mean that simply dividing the annual budget by 52 will rarely be the best solution possible.
Econometric modelling has provided strong evidence for a carry over effect of advertising which is referred to as ‘ad stock’. This is particularly prevalent in AV advertising due to its ability to drive more memorable advertising.
By using ‘ad stock’ effectively it’s possible to elongate campaigns through clever flighting patterns, such as week on, week off advertising, or buying in cheaper months to enable ad stock to flow through into more expensive media periods. This can lead to ROI multipliers of up to 1.2.
Target audience
Due to the way broad media channels work, it’s possible to fine tune your audience target to increase the efficiency of your media. On TV, your buying audience may be Men 16-34, but this doesn’t mean only that group will see your ad, it just means you’ve a better chance of accessing programming that delivers a high proportion of Men aged 16-34.
Much media planning is focussed on optimising the audiences that are bought to find the most cost-effective way of reaching the customers who are most likely to buy your product. As this is such an established practice, the ROI data suggests that opportunities are limited and will only deliver a marginal gain of a 1.1 ROI multiplier.
Brand vs. Performance
Binet & Field have long talked about how important getting the balance between brand and performance (or activation as they refer to it) right. Too much of a swing one way or the other and ROI is diminished.
Accelero’s study found that getting the mix right could increase ROI by x1.6 to x1.8, which echoes recent work by Les Binet in which a series of controlled tests suggested the potential ROI multiplier for optimising to the correct brand : performance split is x2.
The drivers of profitability
Using the above findings, accelero mapped the drivers of profitability in the chart below.
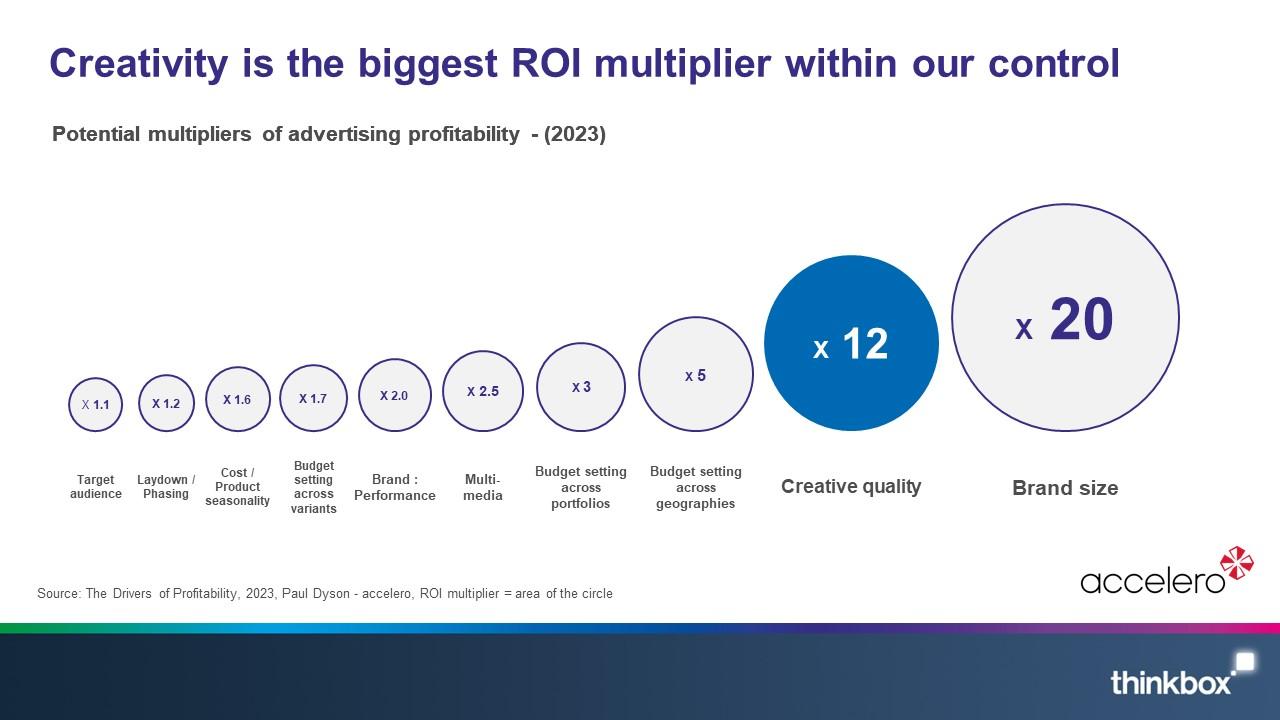
Size of the brand comes in at number one - the biggest single factor influencing the potential advertising driven ROI. This is the same as in 2014.
This is good news for already established, large businesses, and a tough reality of the challenges facing emerging businesses – although it does point to the rewards waiting for those able to successfully scale up over time. Whilst a vital point of advertising effectiveness to understand, it’s not much help; we have little short-term control over the size of the brand we are working for.
This makes the second biggest driver of profitability all the more important, as it’s something marketers very much do have control over. And again – as in 2014 - creative quality took this spot. It has a huge potential to supercharge ROI and, as such, the creative process should be allocated its fair share of resource and effort.
In an increasingly complex media landscape, it’s easy to overlook the importance of a well thought through creative strategy – the recent industry consultation by Laurence Green, ‘From good to great’ highlights that lack of time is one of the biggest barriers to making great work, and that as an industry we’ve become so focused on the width of our ad campaigns – the complexity of the media plan at the point of going live – that we’ve taken our eye of the length of the campaign and the need to have a consistent, effective creative strategy that continues to burn across years rather than months.
But this is not to supersede the vital role of media planning. The majority of the elements on the chart all belong to the world of planning and strategy and collectively deliver the potential for huge ROI multipliers. If you’re not optimising budgets, brand/performance ratios, or buying the most cost-effective audience, then you’re missing out on low-hanging profit multipliers.
What this analysis demonstrates is that in a complex media landscape, expertise and talent is more important than ever. We need to invest time and resource into the right places if we want to drive the maximum profit from our ad spend.
It’s the antithesis to a procurement-driven mindset, because it shows we mustn’t prioritise cost over value. Having a killer creative strategy alongside a well-constructed and optimised media plan is by far the most effective route to profitable growth.