- New tool determines the optimal media mix specific to a brand’s category, budgets and goals
- Developed to help advertisers without their own econometric analysis make media decisions
- Based on findings from a new econometric study of £1.4 billion of advertising media investment
- Study finds that TV has by far the biggest multiplier effect on other channels and delivers the most certain return
- In era of zero-based budgeting, new tool provides starting point for making media investment decisions
London, 21 November 2019: Thinkbox today launched major new research by Gain Theory, MediaCom and Wavemaker, together with a new cross-media optimisation tool based on its findings.
The ‘Demand Generation’ study is an econometric analysis of £1.4 billion of media spend by 50 brands across 10 forms of advertising over 3 years. It offers wide-ranging advice to marketers on how to maximise short-term advertising return without sacrificing sustained base growth.
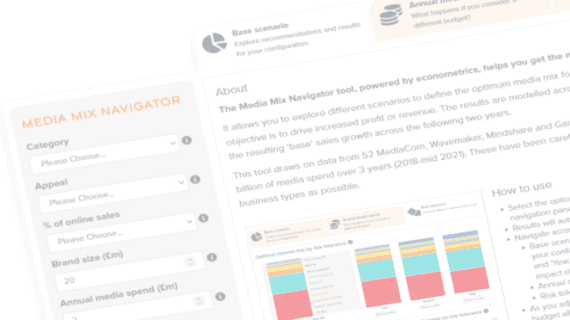
The study has also isolated the principle variables that impact advertising effectiveness, and these have been used to create ‘The Demand Generator’, a new tool that enables marketers to determine the optimal advertising media mix specific to their business and its objectives.
The new study follows Thinkbox’s award-winning ‘Profit Ability: the business case for advertising’ (2017), by Gain Theory and Ebiquity, which established average benchmarks for media performance. But no brand is average, so ‘Demand Generation’ takes this further. It provides practical guidance for medium-to-large advertisers, who don’t have access to their own econometric analysis, on how to maximise their media-driven returns.
Key findings from ‘Demand Generation’
Some forms of advertising are riskier than others
- The variability of returns differs significantly across different forms of advertising
- Linear TV advertising and Broadcaster VOD (BVOD) are the least risky forms of advertising, delivering just 20% of variance compared with the median return
- By comparison, Online display, Cinema, Social media and Print advertising all have a variability of +/- 60% compared with the median return
Most channels boost the efficiency of others, but the scale and consistency of the effect differs significantly
- TV generates the highest ‘multiplier effect’ across all other channels
- TV boosts the performance of other media channels used in a campaign by up to 54%
- Print, for example, boosts other channels’ performance by up to 13%
- The average ‘multiplier effect’ across all channels is around 8%
Within the first 2 weeks of a campaign, TV delivers on average 23% of media-driven sales.
- This is the highest of any pure ‘demand generating’ channel, the next best is Print with 10%
- Generic search, which straddles ‘demand generation’ and ‘demand fulfilment’ and is TV’s natural partner, delivers an average of 29% of media-driven sales within 2 weeks
- Due to the sustained effect of advertising, during the following 6-18 months, TV goes on to deliver a further 2.4 times more sales than it generated in the first 2 weeks
- Generic search goes on to deliver 0.8 times more sales than in the first 2 weeks and Print 1.2 times more
The Demand Generator
The new tool – available here https://www.thinkbox.tv/training-and-tools/media-mix-navigator/media-mix-navigator – offers practical advice on optimal media mixes based on the key variables that influence advertising effectiveness uncovered in the research. These were identified as a brand’s
- Category
- Budget
- Brand size (annual revenue)
- Appeal (e.g. mass market or niche)
- % of sales that take place online
- Desire to minimise risk
The Demand Generator also forecasts the likely business results of following its guidance, both in terms of incremental revenue/profit per year and revenue/profit return on investment (ROI).
Matt Hill, Research and Planning Director, Thinkbox:
“Often we do some research, release the findings and that’s that. So it’s wonderful to create something tangible and practical based on such robust insight. We hope The Demand Generator will be a helpful springboard for the many brands that don’t already do econometric analyses of their media performance. They can tailor it to their exact needs to find the best place to start from when deciding their media mix. With marketers increasingly adopting a zero-based budgeting approach, having a tool like this should provide a great evidence-based foundation on which to build their decisions.”
Jane Christian, Managing Partner, Head of Business Science, MediaCom:
“Demand Generation provides the industry with the broadest view of media performance to date. It goes under the bonnet of what factors drive the optimal media plan for a brand, with The Demand Generator helping advertisers to tailor the result specifically for their brand.”
TV advertising facts at a glance:
- Commercial TV reaches 89% of the UK every week (BARB, 2018)
- Commercial TV’s reach grows to an estimated 95% when Broadcaster VOD is included (IPA Touchpoints & BARB, 2018)
- An average broadcast TV campaign in the UK (of 400 TV ratings) gets 240 million views (BARB, 2018)
- TV advertising is responsible for 71% of total ad-generated profit, at the highest efficiency and for the least risk (Ebiquity/Gain Theory, ‘Profit Ability: the business case for advertising’, 2017)
‘Demand Generation’ methodology
- Meta-analysis of econometric models conducted by Mediacom, Wavemaker & Gain Theory
- Comprised of models for 50 brands, covering 14 product categories.
- Accounting for £1.4 billion of advertising media spend across 3 years
- 6 categories isolated for analysis: FMCG, finance, retail, online retail, automotive, travel
- 10 media channels isolated: TV, broadcaster VOD, online video, cinema, radio, print, online display, generic search, social media, out of home
- Channel risk / channel variability is based on the variance of ROI within the middle 50% of all campaigns analysed (i.e. excludes the worst performing and best performing 25%).
 Thinkbox
